

How Career Connections Benefit STEM Students
July 14, 2021
Monthly Newsletter – July 2021
July 23, 2021
I’m a librarian. My favorite phrase is, “I read the books, I don’t do the math.” But in today’s data-filled world, that’s just not going to cut it. Think of the firehose analogy; our students aren’t just facing a trickle of information but a full-out deluge. How are they supposed to sift through all of the information coming at them? How do they determine the best ways to represent the data they receive? Data literacy is the answer.
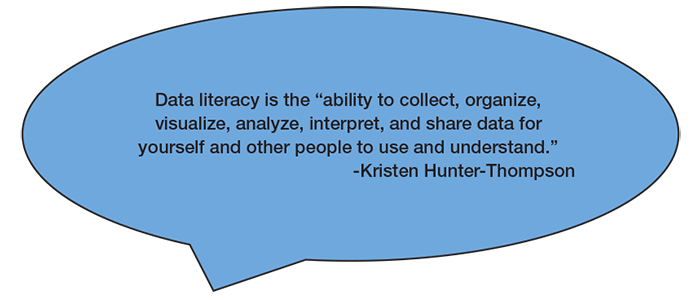
There is so much to unpack in this definition, and I’m going to share this information over several blog posts in the near future. I was lucky enough to find a series of very inexpensive workshops from DATASPIRE that focused on data literacy. I was fascinated by the ways even our youngest students can manipulate data to make meaning. In this data literacy series, I will be leaning heavily on Hunter-Thomson’s work. I’m including links to her work in the resources section of this post.
Using Hunter-Thomson’s definition, we see that data literacy can be categorized into the following areas:
- Collection
- Organization
- Visualization
- Analysis
- Interpretation
- Collaboration/Publication
We’ll cover each of these in more detail, but first let’s examine the “why” of data collection.
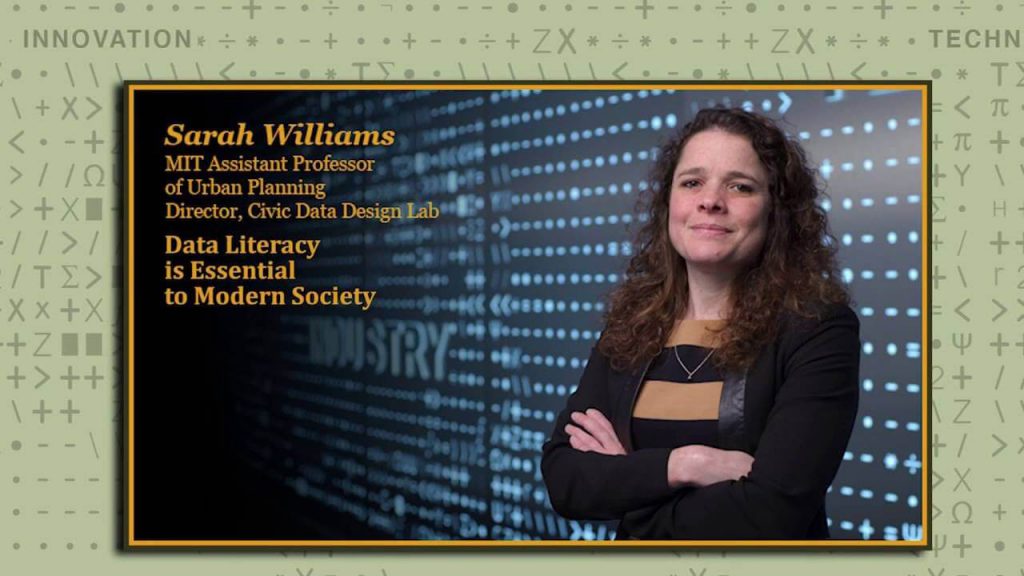
Video courtesy of Sara Williams, MIT Corporate Relations.
Here are some questions to consider as you think about data literacy.
- What does it mean to teach with data?
- What skills do students need in order to be considered “data literate?”
- How are you already using data in your classroom with students?
Principles of Data Literacy
Data literacy can be viewed through the lens of three key principles:
- New data must be scaffolded using students’ existing knowledge and experiences.
- Learning how to use data should be interwoven into the core content.
- Learning should result in both new data skills and a deeper understanding of the subject being taught.
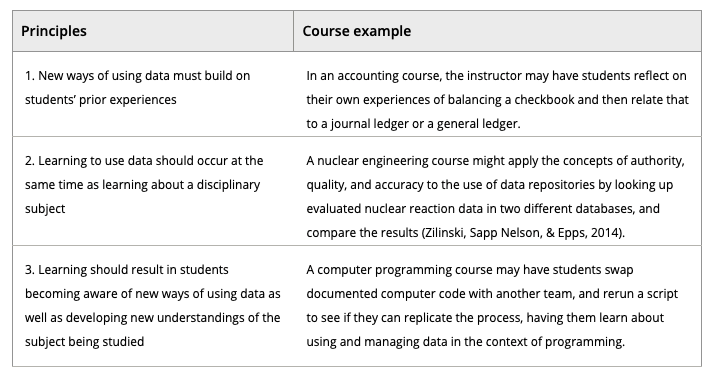
Courtesy of Hughes and Bruce, 2012
In a second grade classroom, this might look like:
NGSS: Structure and Properties of Matter
2-PS1-1. Plan and conduct an investigation to describe and classify different kinds of materials by their observable properties.
- Principle 1: Students discuss, reflect, and draw what they know about the different states of water (solid, liquid, gas). Students formulate questions based on their prior knowledge.
- Principle 2: Students create pictographs as they gather data.
- Principle 3: Students extend the concepts of states of water by learning about molecules.
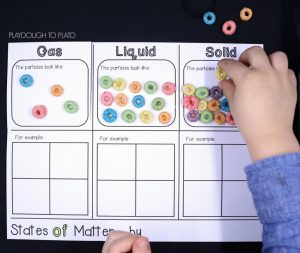
Photo courtesy of Playdough to Plato
Data literacy is a skill set that is often neglected but is incredibly important, especially in the early grades. In the next installment of our series, we’ll look at datasets and how to locate professionally curated sets that your students can use.
Resources
Information is Beautiful – Create graphics and visualizations
Conducting Data Talks – Developing data literacy in elementary students
Data Visualization in Social Studies – A study examining the use of data visualization in K-12 social studies.
How to Help Your Students Develop Digital Literacy Skills
References
Dataspire. (2020). Dataspire. Retrieved July 20, 2021, from Dataspire website: https://dataspire.org/
Hughes, H., & Bruce, C. S. (2012). Snapshots of informed learning: LIS and beyond. Education for Information, 29, 253–269.
MIT Corporate Relations. (2016). 4 – Sara Williams – Data Literacy is Essential to Modern Society [YouTube Video]. Retrieved from https://www.youtube.com/watch?v=4ei7BUMQl5c


